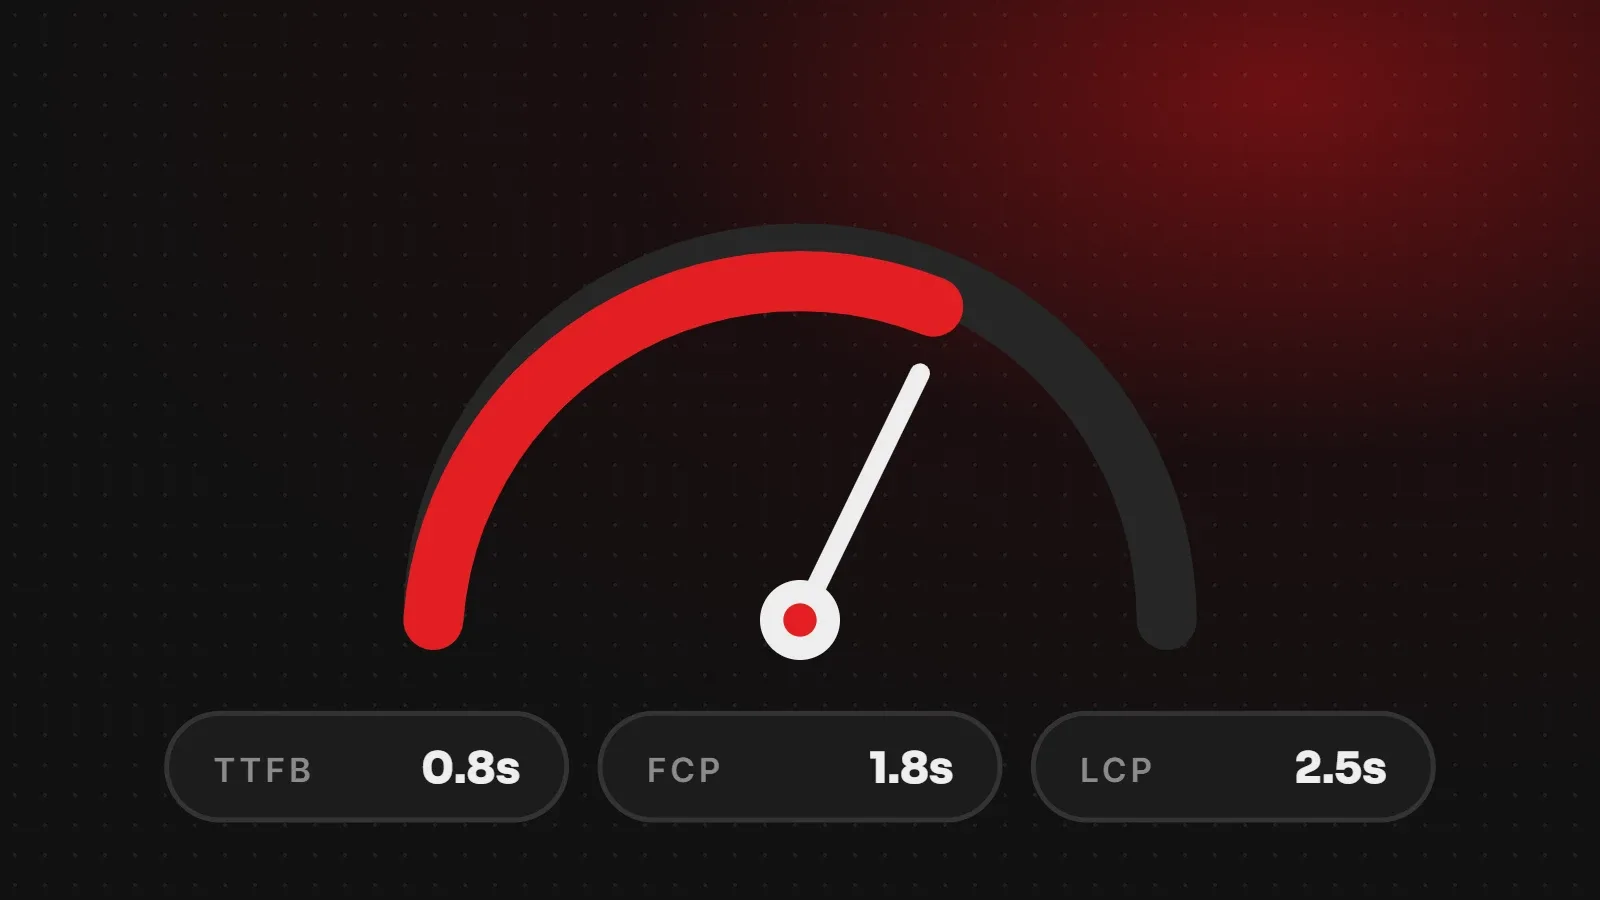
A good page load time today means the main content appears within 2.5 seconds (Largest Contentful Paint), the server starts responding within about 0.8 seconds, and the page reacts to taps within 200 milliseconds. "Fully loaded" time matters less than these numbers, because visitors judge speed by when they can see and use the page. This guide lists the benchmarks that matter and how to measure them on mobile.
- Aim for LCP of 2.5 seconds or less on mobile; that is Google's "good" threshold.
- Server response (TTFB) under 0.8 seconds gives every other metric a head start.
- Measure real-user data where possible, not just a one-off lab test.
Good page load time benchmarks
| Metric | What it measures | Good |
|---|---|---|
| TTFB (Time to First Byte) | How fast the server starts responding | 0.8 s or less |
| FCP (First Contentful Paint) | When anything first appears | 1.8 s or less |
| LCP (Largest Contentful Paint) | When the main content appears | 2.5 s or less |
| INP (Interaction to Next Paint) | How quickly the page responds to input | 200 ms or less |
| CLS (Cumulative Layout Shift) | How much the layout jumps | 0.1 or less |
These thresholds come from Google's web.dev guidance. LCP, INP and CLS are the three Core Web Vitals.
Why "fully loaded" time is misleading
Some tools show a single "fully loaded" number, which includes chat widgets, analytics and ads that load after the page is usable. A page can feel fast at 2 seconds even if it is "fully loaded" at 6 seconds. Therefore focus on when the main content appears and when the page responds, not on the very last file.
A good page load time on mobile
Mobile phones are slower than laptops and mobile networks vary a lot. Google's lab tests simulate a mid-range phone on a slower connection, so mobile scores are always lower. If your real-user Core Web Vitals pass on mobile, your site is fast enough for most visitors, even if the lab score is in the 70s.
Page weight and requests
- Total page size: try to keep key pages under about 2 MB; lighter is better.
- Images: usually the largest part. See our website image size guide.
- JavaScript: heavy scripts hurt responsiveness (INP) on cheaper phones.
- Third-party scripts: each chat, pixel or embed adds requests to other servers.
How to measure your page load time
- Run key pages through PageSpeed Insights and note LCP, INP, CLS and TTFB.
- Check the Core Web Vitals report in Search Console for real-user data across the site.
- Use GTmetrix or WebPageTest to see what loads first and what slows the page.
Our guide on how to check website speed explains each tool.
How to improve a slow page
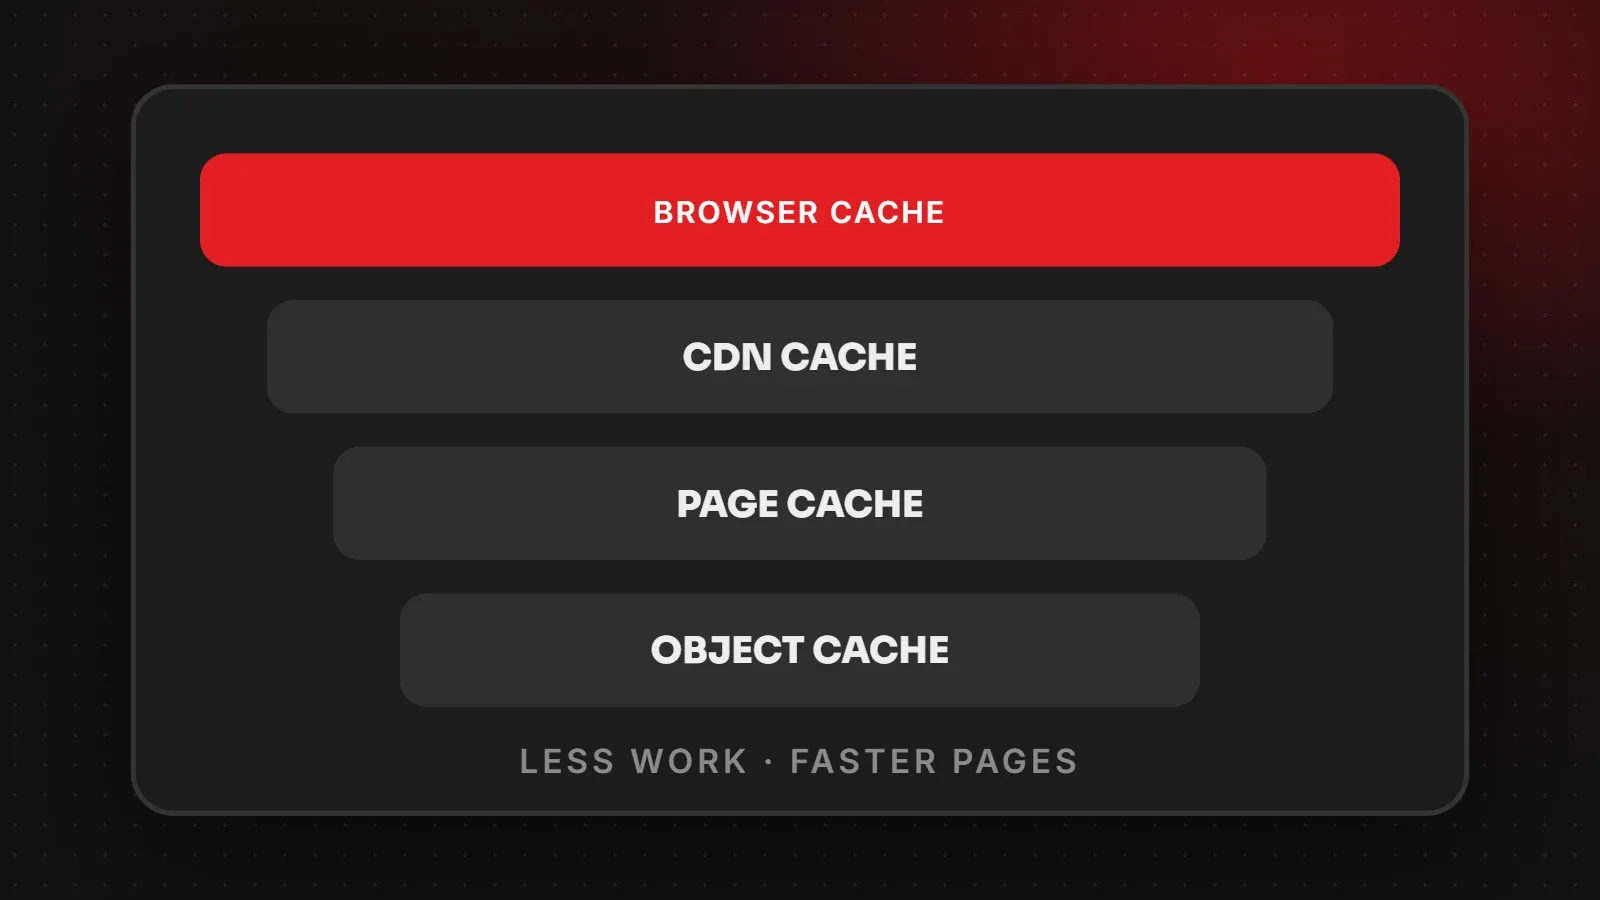
- Faster hosting and caching for TTFB. See what website caching is.
- Smaller, prioritised hero images for LCP. See how to improve LCP.
- Fewer plugins and scripts for INP. See how to speed up WordPress.
- Set image and ad sizes for CLS.
Frequently asked questions
What is a good page load time?
Main content within 2.5 seconds (LCP), server response within 0.8 seconds, and fast responses to taps.
Is a 3-second load time good?
If 3 seconds is your LCP, it is slightly above Google's 2.5-second "good" threshold. Aim lower, especially on mobile.
Why is my site slow only on mobile?
Phones have slower processors and networks. Heavy images and JavaScript affect them most.
Does page speed affect SEO?
Page experience is one of many ranking signals, and speed strongly affects whether visitors stay and buy.
Want your pages under 2.5 seconds?
Our speed and performance team measures real-user data, fixes the slowest parts and proves the improvement. Ask for a free speed check.
Written by the ItsWebExpert team, a web design and development company in Karachi building websites, online stores and apps for businesses across Pakistan.
Ask a Question on WhatsApp