The quickest way to check website speed is to paste your web address into Google PageSpeed Insights. In under a minute it shows how fast the page loads on mobile and desktop, whether it passes Google's Core Web Vitals, and what to fix first. This guide walks through five free speed test tools, explains what the results mean in plain language, and tells you which numbers to focus on.
- Use PageSpeed Insights for a quick check, and Google Search Console to see results across your whole site.
- Focus on the three Core Web Vitals (LCP, INP, CLS) rather than chasing a perfect score.
- Always test the mobile version, because most visitors arrive on phones.
5 free tools to check website speed
| Tool | Best for |
|---|---|
| Google PageSpeed Insights | Quick test of any single page, with real-user data and suggestions |
| Google Search Console | Core Web Vitals across your whole website over time |
| Lighthouse (built into Chrome) | Testing pages privately, including pages not yet live |
| GTmetrix | A visual timeline of what loads and when |
| WebPageTest | Detailed tests from different locations and connection speeds |
1. Google PageSpeed Insights
Go to pagespeed.web.dev, enter a URL and click Analyze. You get two kinds of results:
- Field data ("Discover what your real users are experiencing"): how the page performed for real Chrome users over the last 28 days. This is what Google uses for ranking signals. Small or new sites may not have enough visitors to show this section.
- Lab data (the score out of 100): a simulated test on a mid-range phone with a slower connection. It is useful for finding problems, but it is not what real visitors see.
2. Google Search Console
Open the Core Web Vitals report under Experience. It groups your pages into Good, Needs improvement and Poor for mobile and desktop. As a result, it is the best way to find which types of pages are slow, for example all product pages, rather than testing them one by one.
3. Lighthouse in Chrome
Right-click any page, choose Inspect, open the Lighthouse tab and run a report. It gives the same kind of lab score as PageSpeed Insights. In addition, it works on staging sites and pages behind a login.
4. GTmetrix
GTmetrix shows a waterfall chart: a list of every file the page loads, in order, with the time each one takes. For this reason, it makes it easy to spot a huge image, a slow plugin or a third-party script holding up the page.
5. WebPageTest
WebPageTest lets you choose the test location, device and connection speed. It is useful when your visitors are in a different country from your server, for example a Pakistani business selling to customers in the UK or the Gulf.
What the results mean when you check website speed
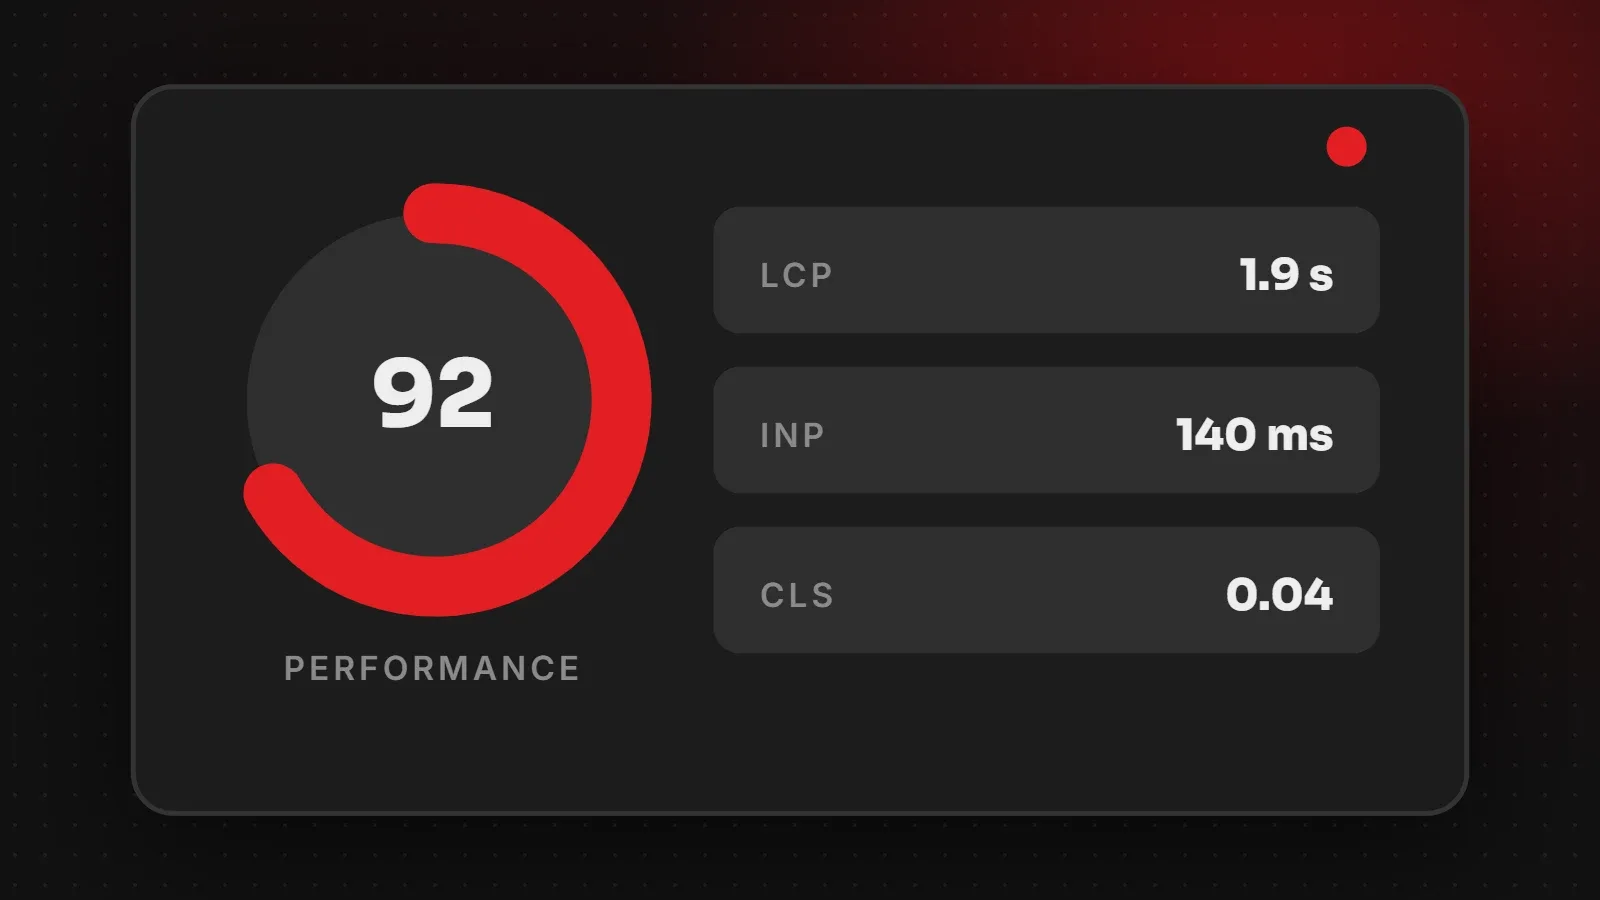
Google's Core Web Vitals are the three numbers that matter most:
| Metric | What it measures | Good | Poor |
|---|---|---|---|
| LCP (Largest Contentful Paint) | How long until the main content appears | 2.5 s or less | Over 4 s |
| INP (Interaction to Next Paint) | How quickly the page reacts to taps and clicks | 200 ms or less | Over 500 ms |
| CLS (Cumulative Layout Shift) | How much the layout jumps while loading | 0.1 or less | Over 0.25 |
You will also see other numbers such as First Contentful Paint (when anything first appears), Speed Index and Total Blocking Time. They help explain why a page is slow, but the three Core Web Vitals are the headline figures.
How to check website speed properly
- Test your most important pages, not just the homepage: a product page, a service page, a blog post and your contact page.
- Test mobile first, then desktop.
- Run each test two or three times. Lab results vary from run to run, so look at the typical result.
- Write down the results before you make changes, so you can measure the improvement.
- Retest after each fix rather than changing ten things at once.
The most common problems speed tests find
- "Properly size images" and "Serve images in next-gen formats": images are too large or not in WebP. See our website image size guide.
- "Reduce unused JavaScript": too many plugins, sliders or tracking scripts.
- "Reduce initial server response time": slow or overloaded hosting, or no caching.
- "Eliminate render-blocking resources": CSS and scripts that must load before anything shows.
- "Avoid large layout shifts": images, ads or banners without set dimensions.
Our website speed guide explains how to fix each of these.
Frequently asked questions
What is a good website speed score?
A PageSpeed score of 90 or above is considered good, but passing the three Core Web Vitals for real users matters more than the score itself.
Why is my mobile score lower than desktop?
The mobile test simulates a slower phone and network, so the same page always scores lower on mobile.
Why do I get a different score each time?
Server load, network conditions and third-party scripts all affect lab tests. Run the test a few times and use the typical result.
Is website speed a Google ranking factor?
Page experience, including Core Web Vitals, is one of many signals Google uses. Great content still matters most, but speed can make the difference between similar pages and it strongly affects whether visitors stay.
Want us to check your website speed?
If the reports are confusing or the fixes look technical, we can help. Our speed and performance team runs a full audit, explains the results in plain language and fixes the issues, and our fast web hosting removes slow servers from the picture. Ask for a free speed check.
Written by the ItsWebExpert team, a web design and development company in Karachi building websites, online stores and apps for businesses across Pakistan.
Ask a Question on WhatsApp